Regression Sample
Numerics.NET supports simple and multiple linear regression with optional transformation of variables. The Regress sample illustrates these capabilities.
About Linear Regression
Linear regression is one of the basic techniques of statistical analysis. The somewhat peculiar name derives from the original investigations by sir Francis Galton in the 19th century.
Linear regression is a means of establishing a linear relationship between a dependent variable and one or more independent variables. In simple regression there is only one independent variable. In multiple regression, there are more than one independent variables.
The analysis gives information about the signficance of the contributions of the independent variables, and allows you to predict the values of the dependent variable for new values of the independent variables.
How to use the program
The Regress program has a simple tab based interface.
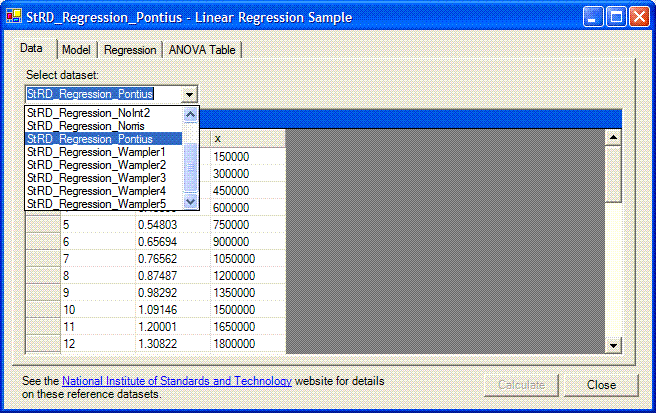
The first tab lets you select the dataset. It shows a dropdown list and a grid. When you select a dataset from the dropdown list, the data appears in the grid. The data is stored in an Access database, and are taken from the National Institute for Standards and Technology’s Statistical Reference Datasets website. The Institute provides certified results that were calculated using very high precision (500 digits).
Once a dataset has been selected, you can construct the model using the Model tab. This tab has three parts. On the left is a list of numerical variables in the selected dataset. In the middle are a text box for the dependent variable, a list of independent variables, and a series of companion buttons. On the right is a panel with several model options.
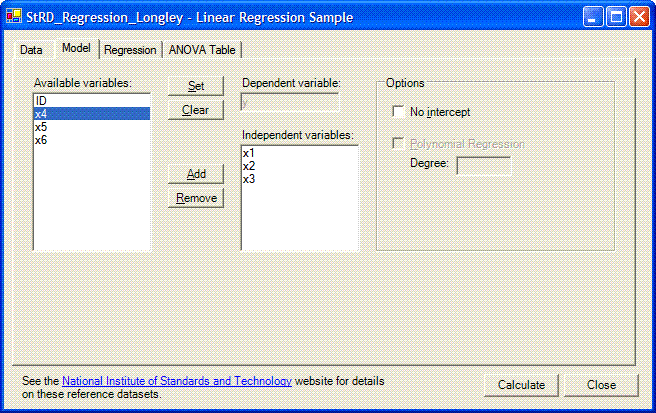
You select the dependent variable by selecting it in the variables list and clicking the ‘Set’ button next to the dependent variable box. You can clear the dependent variable by clicking on the clear button.
You select the independent variables by selecting them one at a time from the variables list and clicking the ‘Add’ button. To remove an independent variable, click the remove button.
The options panel has two checkboxes. The first lets you specify whether to include a constant term or intercept in the model. The second checkbox lets you perform a polynomial regression. You must also specify the degree of the polynomial, which must be less than the number of data points. There can only be one independent variable for this option to be available.
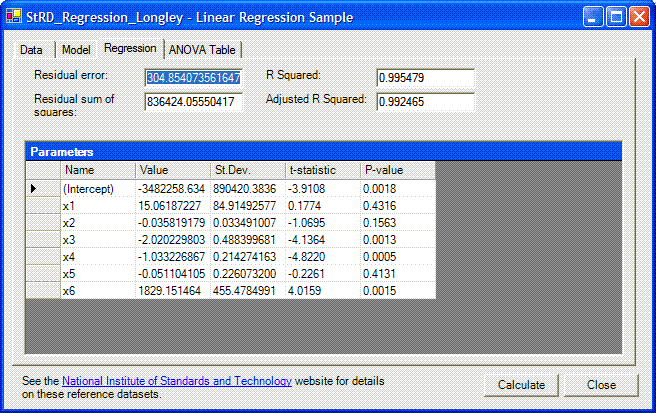
Clicking the ‘Calculate’ button performs the actual calculation, and brings you to the Regression tab. The global properties of the regression model such as residual error and the R-squared value are given in the top half of the page. The bottom half is taken up by a list of the regression parameters and their standard errors.
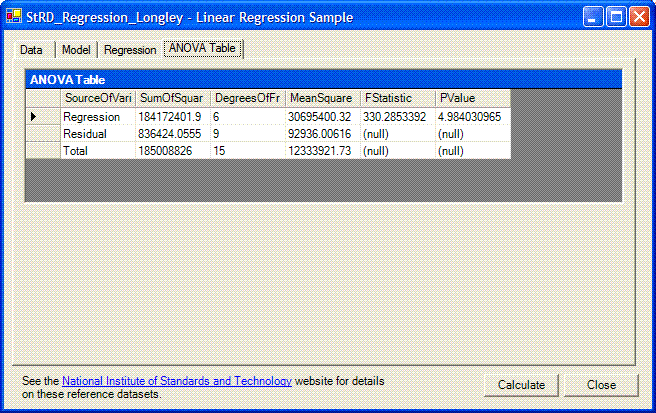
Finally, the Anova Table tab shows the ANOVA table for the regression model.
The sample code
Most of the code in this sample deals with the user interface.
Handling the data
A DataFrame<R,C>
is the object that corresponds to a statistical dataset.
A dataframe can be created in a variety of ways.
One of the simplest is illustrated here: a DataTable or DataTableView object can be transformed directly
into a VariableCollection as
follows:
// Load the DataTableDataTable dt = null;
OleDbDataAdapter da = new OleDbDataAdapter("Select * from " + tableName, cnn);
dt = new DataTable();
da.Fill(dt);

// Create the variables collection straight from the DataTable:
variables = new VariableCollection(dt);
Variables can also be created from arrays or DataColumn objects, or they can be returned as the
result of a calculation or transformation involving one or more other
variables.
Performing the calculation
Most of the really interesting code is contained in the Calculate method:
private void cmdCalculate_Click(object sender, System.EventArgs e)
{
    if (!CanCompute())
        return;

    // Set up the model:    LinearRegressionModel model;
    if (chkPolynomial.Checked)
    {
        // Get the degree of the polynomial:        int degree;
        try        {
            degree = Int32.Parse(txtDegree.Text);
            if (degree >= variables.RowCount)
            {
                MessageBox.Show(
                    "Degree must be an integer less than the number of data points.");
                return;
            }
        }
        catch (FormatException)
        {
            MessageBox.Show(
                "Degree must be an integer less than the number of data points.");
            return;
        }
        // Finally, create the model.        model = new PolynomialRegressionModel(variables,
            txtDependent.Text, lstIndependent.Items[0].ToString(), degree);
    }
    else    {
        // For a 'classic' multiple regression, we can use the variable names instead:        string[] independents = new string[lstIndependent.Items.Count];
        lstIndependent.Items.CopyTo(independents, 0);
        string dependent = txtDependent.Text;
        // Now create the model:        model = new LinearRegressionModel(variables, dependent, independents);
    }

    // Check if we want an intercept in the model:    model.NoIntercept = chkNoIntercept.Checked;
    // Compute the model    model.Compute();
    // Show results    // ...}
The first step in computing the regression is creating
the model. Regression models are implemented by the LinearRegressionModel class. The details depend on
whether we want a polynomial regression or a simple linear regression.
In case of a polynomial regression, we use the PolynomialRegressionModel class, which inherits from
LinearRegressionModel. In case of normal
multiple regression, we can simply pass the names of the variables in the VariableCollection together with the collection to
the constructor.
The actual calculation is performed by the Fit method.
The remainder of the Calculate method is spent filling in the data on the
Regression and Anova Table tabs. Note that an AnovaTable object can be converted
directly into a DataTable object for direct binding with a
DataGrid.